- 变换
- 组合
- 像素缓存
- Canvas 绘制
- 从 HTML5 移植
变换
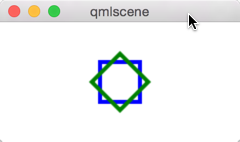
Canvas中的“变形”,主要指的是坐标系的变换,而不是路径的变换。这与 QML 元素变换非常相似,都可以实现坐标系统的scale(缩放)、rotate(旋转)和translate(平移);不同的是,变换的原点是画布原点。例如,如果以一个路径的中心点为定点进行缩放,那么,你需要现将画布原点移动到路径中心点。我们也可以使用变换函数实现复杂的变换。理解“变换是针对坐标系的”这一点非常重要,有时候可以避免很多意外的结果。
- import QtQuick 2.0
- Canvas {
- id: root
- width: 240; height: 120
- onPaint: {
- var ctx = getContext("2d")
- ctx.strokeStyle = "blue"
- ctx.lineWidth = 4
- ctx.translate(120, 60)
- ctx.strokeRect(-20, -20, 40, 40)
- // draw path now rotated
- ctx.strokeStyle = "green"
- ctx.rotate(Math.PI / 4)
- ctx.strokeRect(-20, -20, 40, 40)
- ctx.restore()
- }
- }
运行结果如下:
通过调用resetTransform()函数,可以将变换矩阵重置为单位矩阵:
- ctx.resetTransform()
组合
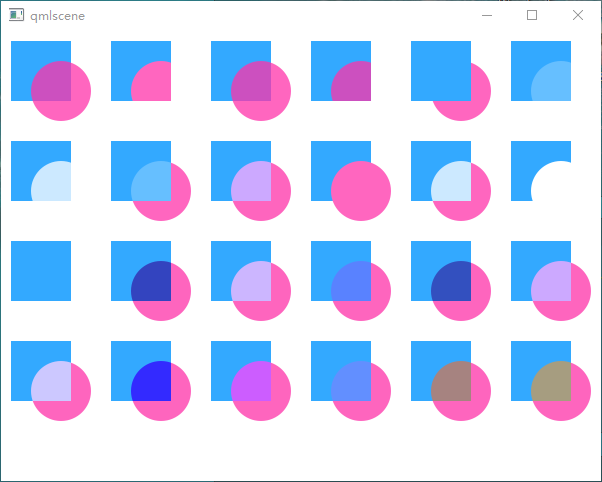
组合意思是,将你绘制的图形与已存在的像素做一些融合操作。canvas支持几种组合方式,使用globalCompositeOperation可以设置组合的模式。如下代码所示,我们可以看到组合的相应表现:
- import QtQuick 2.0
- Canvas {
- id: root
- width: 600; height: 450
- property var operation : [
- 'source-over', 'source-in', 'source-over',
- 'source-atop', 'destination-over', 'destination-in',
- 'destination-out', 'destination-atop', 'lighter',
- 'copy', 'xor', 'qt-clear', 'qt-destination',
- 'qt-multiply', 'qt-screen', 'qt-overlay', 'qt-darken',
- 'qt-lighten', 'qt-color-dodge', 'qt-color-burn',
- 'qt-hard-light', 'qt-soft-light', 'qt-difference',
- 'qt-exclusion'
- ]
- onPaint: {
- var ctx = getContext('2d')
- for(var i=0; i<operation.length; i++) {
- var dx = Math.floor(i%6)*100
- var dy = Math.floor(i/6)*100
- ctx.save()
- ctx.fillStyle = '#33a9ff'
- ctx.fillRect(10+dx,10+dy,60,60)
- // TODO: does not work yet
- ctx.globalCompositeOperation = root.operation[i]
- ctx.fillStyle = '#ff33a9'
- ctx.globalAlpha = 0.75
- ctx.beginPath()
- ctx.arc(60+dx, 60+dy, 30, 0, 2*Math.PI)
- ctx.closePath()
- ctx.fill()
- ctx.restore()
- }
- }
- }
代码运行结果如下:
像素缓存
使用canvas,你可以将canvas内容的像素数据读取出来,并且能够针对这些数据做一些操作。
使用createImageData(sw, sh)或getImageData(sx, sy, sw, sh)函数可以读取图像数据。这两个函数都会返回一个ImageData对象,该对象具有width、height和data等变量。data包含一个以 RGBA 格式存储的像素一维数组,其每一个分量值的范围都是 [0, 255]。如果要设置画布上面的像素,可以使用putImageData(imagedata, dx, dy)函数。
另外一个获取画布内容的方法是,将数据保存到一个图片。这可以通过Canvas的函数save(path)或toDataURL(mimeType)实现,后者会返回一个图像的 URL,可以供Image元素加载图像。
- import QtQuick 2.0
- Rectangle {
- width: 240; height: 120
- Canvas {
- id: canvas
- x: 10; y: 10
- width: 100; height: 100
- property real hue: 0.0
- onPaint: {
- var ctx = getContext("2d")
- var x = 10 + Math.random(80)*80
- var y = 10 + Math.random(80)*80
- hue += Math.random()*0.1
- if(hue > 1.0) { hue -= 1 }
- ctx.globalAlpha = 0.7
- ctx.fillStyle = Qt.hsla(hue, 0.5, 0.5, 1.0)
- ctx.beginPath()
- ctx.moveTo(x+5,y)
- ctx.arc(x,y, x/10, 0, 360)
- ctx.closePath()
- ctx.fill()
- }
- MouseArea {
- anchors.fill: parent
- onClicked: {
- var url = canvas.toDataURL('image/png')
- print('image url=', url)
- image.source = url
- }
- }
- }
- Image {
- id: image
- x: 130; y: 10
- width: 100; height: 100
- }
- Timer {
- interval: 1000
- running: true
- triggeredOnStart: true
- repeat: true
- onTriggered: canvas.requestPaint()
- }
- }
在上面的例子中,我们创建了两个画布,左侧的画布每一秒产生一个圆点;鼠标点击会将画布内容保存,并且生成一个图像的 URL,右侧则会显示这个图像。
Canvas 绘制
下面我们利用Canvas元素创建一个画板程序。我们程序的运行结果如下所示: 窗口上方是调色板,用于设置画笔颜色。色板是一个填充了颜色的矩形,其中覆盖了一个鼠标区域,用于检测鼠标点击事件。
- Row {
- id: colorTools
- anchors {
- horizontalCenter: parent.horizontalCenter
- top: parent.top
- topMargin: 8
- }
- property color paintColor: "#33B5E5"
- spacing: 4
- Repeater {
- model: ["#33B5E5", "#99CC00", "#FFBB33", "#FF4444"]
- ColorSquare {
- id: red
- color: modelData
- active: parent.paintColor === color
- onClicked: {
- parent.paintColor = color
- }
- }
- }
- }
调色板所支持的颜色保存在一个数组中,画笔的当前颜色则保存在paintColor属性。当用户点击调色板的一个色块,该色块的颜色就会被赋值给paintColor属性。
为了监听鼠标事件,我们在画布上面覆盖了一个鼠标区域,利用鼠标按下和位置改变的信号处理函数完成绘制:
- Canvas {
- id: canvas
- anchors {
- left: parent.left
- right: parent.right
- top: colorTools.bottom
- bottom: parent.bottom
- margins: 8
- }
- property real lastX
- property real lastY
- property color color: colorTools.paintColor
- onPaint: {
- var ctx = getContext('2d')
- ctx.lineWidth = 1.5
- ctx.strokeStyle = canvas.color
- ctx.beginPath()
- ctx.moveTo(lastX, lastY)
- lastX = area.mouseX
- lastY = area.mouseY
- ctx.lineTo(lastX, lastY)
- ctx.stroke()
- }
- MouseArea {
- id: area
- anchors.fill: parent
- onPressed: {
- canvas.lastX = mouseX
- canvas.lastY = mouseY
- }
- onPositionChanged: {
- canvas.requestPaint()
- }
- }
- }
鼠标左键按下时,其初始位置保存在lastX和lastY两个属性。鼠标位置的改变会请求画布进行重绘,该请求则会调用onPaint()处理函数。
最后,为了绘制用户笔记,在onPaint()处理函数中,我们首先创建了一个新的路径,将其移动到最后的位置,然后我们从鼠标区域获得新的位置,在最后的位置与新的位置之间绘制直线,同时,将当前鼠标位置(也就是新的位置)设置为新的最后的位置。
从 HTML5 移植
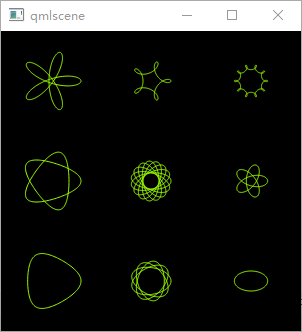
由于 QML 的Canvas对象由 HTML 5 的 canvas 标签借鉴而来,将 HTML 5 的 canvas 应用移植到 QML Canvas也是相当容易。我们以 Mozilla 提供的繁华曲线页面为例,演示移植的过程。可以在这里看到该页面的运行结果。下面是 HTML 5 canvas 的脚本部分:
- function draw() {
- var ctx = document.getElementById('canvas').getContext('2d');
- ctx.fillRect(0,0,300,300);
- for (var i=0;i<3;i++) {
- for (var j=0;j<3;j++) {
- ctx.save();
- ctx.strokeStyle = "#9CFF00";
- ctx.translate(50+j*100,50+i*100);
- drawSpirograph(ctx,20*(j+2)/(j+1),-8*(i+3)/(i+1),10);
- ctx.restore();
- }
- }
- }
- function drawSpirograph(ctx,R,r,O){
- var x1 = R-O;
- var y1 = 0;
- var i = 1;
- ctx.beginPath();
- ctx.moveTo(x1,y1);
- do {
- if (i>20000) break;
- var x2 = (R+r)*Math.cos(i*Math.PI/72) - (r+O)*Math.cos(((R+r)/r)*(i*Math.PI/72))
- var y2 = (R+r)*Math.sin(i*Math.PI/72) - (r+O)*Math.sin(((R+r)/r)*(i*Math.PI/72))
- ctx.lineTo(x2,y2);
- x1 = x2;
- y1 = y2;
- i++;
- } while (x2 != R-O && y2 != 0 );
- ctx.stroke();
- }
- draw();
这里我们只解释如何进行移植,有关繁花曲线的算法则不在我们的阐述范围之内。幸运的是,我们需要改变的代码很少,因而这里也会很短。
HTML 按照顺序执行,draw() 会成为脚本的入口函数。但是在 QML 中,绘制必须在 onPaint 中完成,因此,我们需要将 draw() 函数的调用移至 onPaint。通常我们会在 onPaint 中获取绘制上下文,因此,我们将给 draw() 函数添加一个参数,用于接受Context2D对象。事实上,这就是我们所有的修改。移植之后的 QML 如下所示:
- import QtQuick 2.2
- Canvas {
- id: root
- width: 300; height: 300
- onPaint: {
- var ctx = getContext("2d");
- draw(ctx);
- }
- function draw (ctx) {
- ctx.fillRect(0, 0, 300, 300);
- for (var i = 0; i < 3; i++) {
- for (var j = 0; j < 3; j++) {
- ctx.save();
- ctx.strokeStyle = "#9CFF00";
- ctx.translate(50 + j * 100, 50 + i * 100);
- drawSpirograph(ctx, 20 * (j + 2) / (j + 1), -8 * (i + 3) / (i + 1), 10);
- ctx.restore();
- }
- }
- }
- function drawSpirograph (ctx, R, r, O) {
- var x1 = R - O;
- var y1 = 0;
- var i = 1;
- ctx.beginPath();
- ctx.moveTo(x1, y1);
- do {
- if (i > 20000) break;
- var x2 = (R + r) * Math.cos(i * Math.PI / 72) - (r + O) * Math.cos(((R + r) / r) * (i * Math.PI / 72))
- var y2 = (R + r) * Math.sin(i * Math.PI / 72) - (r + O) * Math.sin(((R + r) / r) * (i * Math.PI / 72))
- ctx.lineTo(x2, y2);
- x1 = x2;
- y1 = y2;
- i++;
- } while (x2 != R-O && y2 != 0 );
- ctx.stroke();
- }
- }
运行一下这段代码:

